

Zuplo OpenTelemetry
Zuplo ships with an OpenTelemetry plugin that allows you to collect and export telemetry data from your Zuplo API. The OpenTelemetry plugin supports tracing and logging. Metrics support is planned for future releases.
Enterprise Feature
OpenTelemetry is available as an add-on as part of an enterprise plan. If you would like to purchase this feature, please contact us at sales@zuplo.com or reach out to your account manager.
Most enterprise features can be used in a trial mode for a limited time. Feel free to use enterprise features for development and testing purposes.
Tracing
Tracing enables you to monitor performance, identify bottlenecks, and troubleshoot issues in your Zuplo API. The OpenTelemetry plugin automatically instruments your API to collect trace data. You can send trace data any OpenTelemetry service such as Honeycomb, Middleware, Dynatrace, Jaeger, and many more.
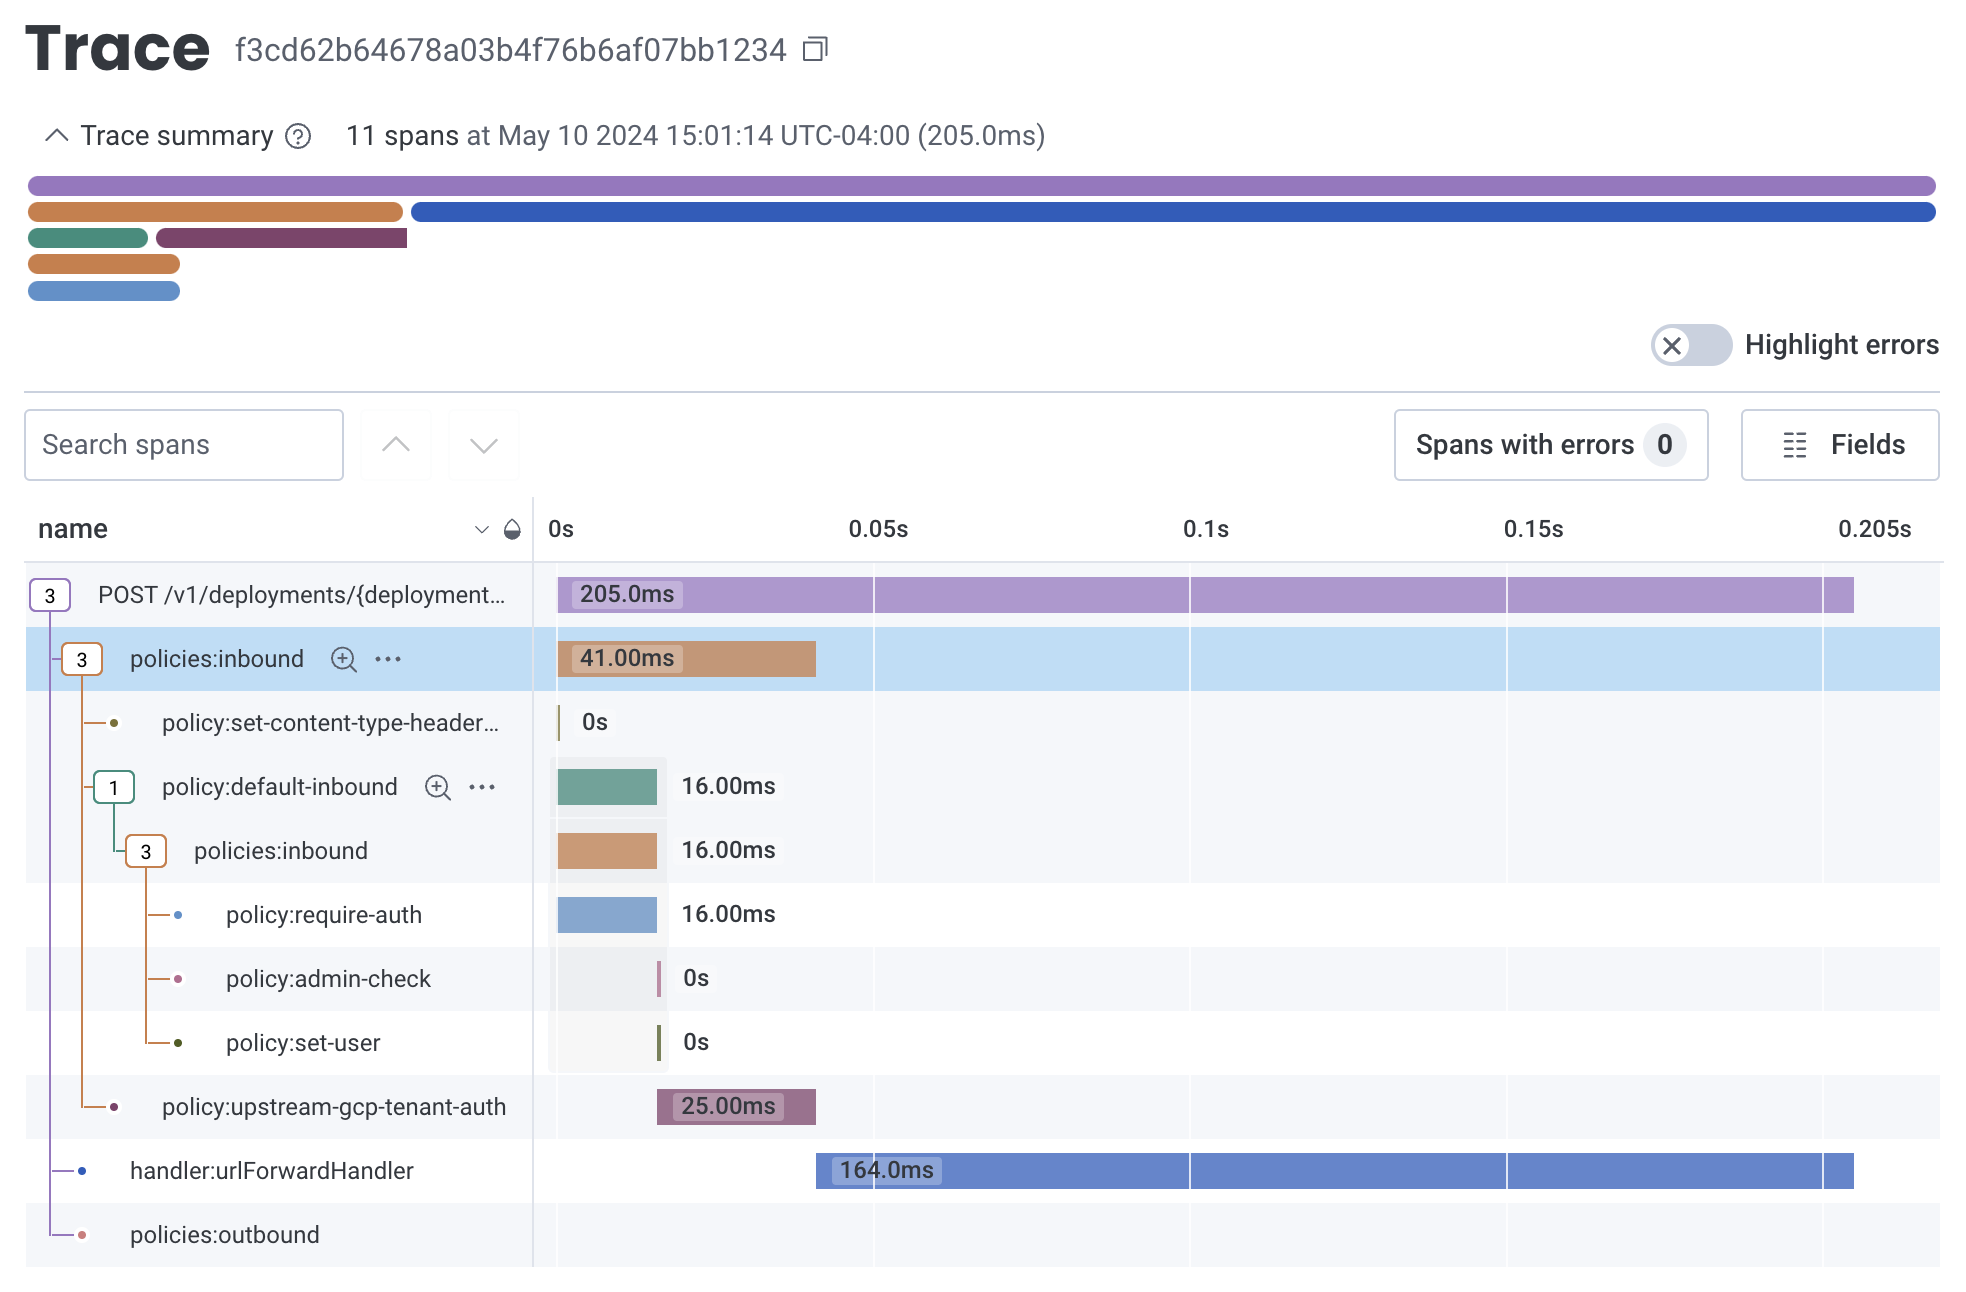
With tracing enabled on your Zuplo API you will see timings for each request as well as spans for plugins, handlers, and policies. The OpenTelemetry plugin supports trace propagation (W3C headers by default) so you can trace requests all the way from the client to your backend.
What's Traced?
By default, when the OpenTelemetry plugin is enabled, the following is traced:
- Request: The entire request lifecycle is traced, including the time taken to process the request and send the response.
- Inbound Policies: The time taken to execute all inbound policies as well as each policy is traced.
- Handler: The request handler is traced
- Outbound Policies: The time taken to execute all outbound policies as well as each policy is traced.
- Subrequests: Any use of
fetchwithin your custom policies or handlers will be traced.
Limitations
One important limitation to keep in mind is that the clock will only increment
when performing I/O operations (for example when calling fetch, using the
Cache APIs, etc.). This is a limitation imposed as a security measure due
Zuplo's serverless, multi-tenant architecture. In practice this shouldn't impact
your ability to trace as virtually any code that isn't I/O bound is fast.
Custom Tracing
You can add custom tracing to your Zuplo API by using the OpenTelemetry API. The example below shows how to implement tracing in a custom policy.
Code
This will result in a span that has the following spans:
Code
Logging
Logging can be enabled by configuring the logUrl property in the OpenTelemetry
plugin configuration, as shown in
Tracing and Logging Configuration. When
enabled, logs will be exported to the specified endpoint in OpenTelemetry
format.
To add OpenTelemetry logs in your Zuplo handlers and policies, you can use the
context.log object as shown below:
Code
You can also set additional custom log properties using
context.log.setLogProperties!:
Code
After setting a custom property, all subsequent log messages will include that property.
These logs will be exported to the configured log endpoint in OpenTelemetry
format. The log message will be in the message field and the custom properties
will be in the attributes field.
Setup
Adding OpenTelemetry to your Zuplo API is done by adding the
OpenTelemetryPlugin in the zuplo.runtime.ts file as shown below.
OpenTelemetry Protocol
The Zuplo OpenTelemetry plugin only supports sending data in JSON format. Not all OpenTelemetry services support the JSON format. If you are using a service that doesn't support JSON, you will need to use a tool like the OpenTelemetry Collector that can convert the JSON format to the format required by your service.
Basic Tracing Configuration
For most providers you will set values for exporter.url and
exporter.headers. It's common for providers to use a header for authorization.
zuplo.runtime.ts
Advanced Tracing Configuration
The OpenTelemetry plugin supports additional configuration options for advanced use cases, including sampling and post-processing of spans.
zuplo.runtime.ts
Tracing and Logging Configuration
Logging is only enabled when specifically configured with its own endpoint using
the logUrl property. When using both tracing and logging, you can configure
them with separate endpoints.
zuplo.runtime.ts